Within a decade Japan’s electricity consumption and generation have significantly changed, largely as a consequence of Fukushima Daiichi nuclear disaster in March 2011. Compared to fiscal year (FY) 2010, the three most remarkable progress as of FY2018 were:1
- 1. A substantial reduction in electricity consumption enabled by energy efficiency gains and conservation efforts; -246 terawatt-hours (TWh) that can be broken down into -145 TWh of actual consumption reduction and -101 TWh of avoided consumption (assuming constant electric intensity of the economy at FY2010 level – Japan’s gross domestic product grew by 9% in the period),2
- 2. A significant decrease in electricity generation from nuclear power because of difficulties in restarting reactors (only 9 of the country’s 37 reactors had restarted commercial operation – as of early September 2019); -223 TWh,3 and
- 3. An increase in electricity generation from renewable energy (RE); +70 TWh.
Japan Change in Electricity Generation and Consumption FY2018-FY2010
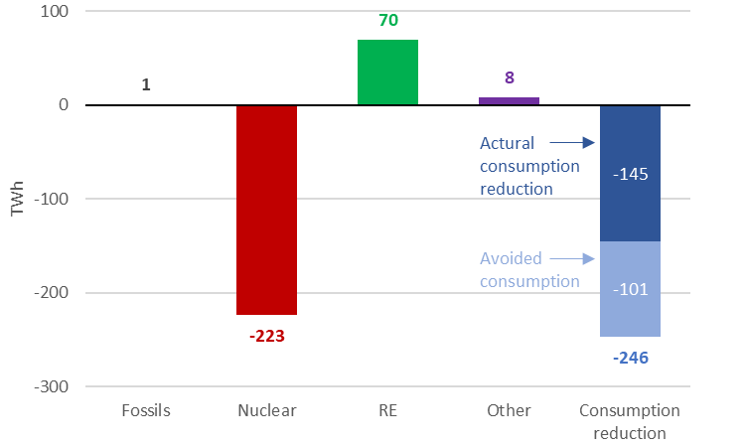
Source: IEA
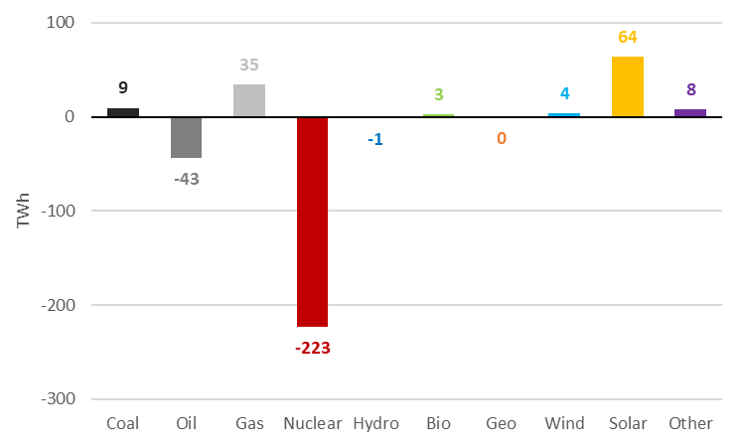
When looking into more details on the generation side only, we can observe that of all power technologies solar grew most by far; +64 TWh. This impressive growth of solar power is largely the result of the introduction of a generous feed-in tariff in July 2012, initially about ¥40 per kilowatt-hour (/kWh). As demonstrated by a recent auction in which prices fell to a record low of about ¥10/kWh, future deployment of the technology will, however, be based on much stronger economic grounds.4 Among other most remarkable changes, gas (+35 TWh) and coal (+9 TWh) combined increases just offset the important decrease in electricity generation from oil (-43 TWh). Changes regarding other technologies were either limited: other (growth essentially coming from industrial waste), wind, and bio, or negligible: hydro and geothermal.
Japan Change in Electricity Generation FY2018-FY2010
As a result of these changes, nuclear power share in Japan’s electricity generation mix collapsed from 25% in FY2010 to only 6% in FY2018 (roughly -20 percentage points (pp)). And the shares of both fossil fuels and RE increased in a relatively similar order of magnitude of approximately 10 pp, reaching around 70% and almost 20% – a quasi-doubling, respectively.
[Left] Japan Electricity Generation Mix FY2010 (%) [Right] Japan Electricity Generation Mix FY2018 (%)
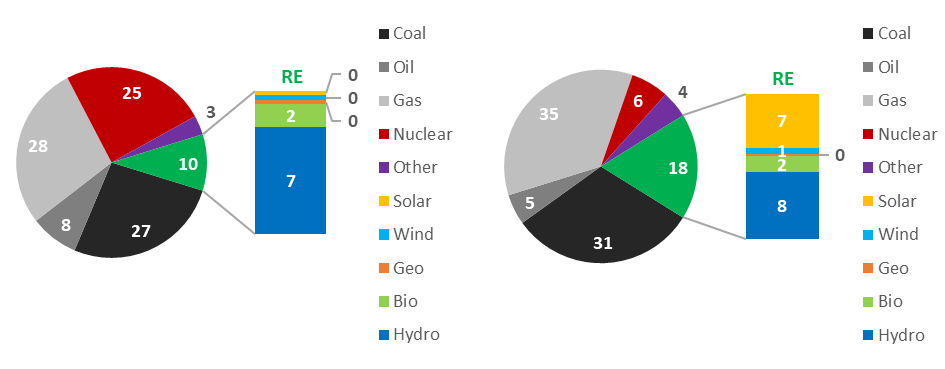
This makes Japan already within reach of its RE 2030 target of 22-24%. It also shows how complicated it will be for the country to meet its nuclear 2030 target of 20-22%. This should certainly prompt Japanese decision makers to rebalance their ambitions for low carbon technologies and pursue RE and energy efficiency more aggressively instead, in order to successfully satisfy the country’s climate change pledge (reduction of greenhouse gas emissions of 26% by FY2030 compared to FY2013). In this regard, a very powerful and convincing message that this is absolutely feasible is that in FY2018 energy savings and RE have together met 97% of nuclear power decrease and of Japan’s electricity needs for economic growth – basically all.
- 1In this column all electricity data come from two publications of the International Energy Agency (IEA), Electricity Information 2019 (September 2019) and Renewables Information 2019 (August 2019).
- 2Government of Japan, Cabinet Office, Economic and Social Research Institute, National Accounts of Japan – Quarterly Estimates of GDP (accessed September 6, 2019). Constant 2011 Japanese yen (¥).
- 3Japan Atomic Industrial Forum, Current Status of Nuclear Power Plants in Japan – September 5, 2019 (accessed September 13, 2019).
- 4Isshu Kikuma, BloombergNEF, Solar Auction Finally Succeeds in Japan – September 4, 2019 (subscription required – accessed September 6, 2019).