In the first half of 2022 renewable energy electricity grew phenomenally across the world enabling decreases in electricity generation from fossil fuels and nuclear power. However, even this extraordinary growth has been insufficient to trigger a deep decarbonization of the power sector – a prerequisite for carbon neutrality. This means further accelerating renewable energy expansion is necessary. To achieve this new acceleration, taking even more advantage of renewable energy’s strengths (economics and energy security) – magnified by the ongoing global energy crisis – and overcoming obstacles slowing down progress (integration challenges and public support) is critical.
Renewable energy electricity phenomenal growth in 2022 H1
From January to June 2022 (i.e., 2022 H1), amidst the worst global energy crisis since the oil shocks of the 1970s, the world witnessed an exceptional renewable energy (RE) electricity growth. Indeed, according to statistics from the International Energy Agency (IEA) covering 47 countries accounting for about 80% of global electricity generation, net electricity generation (i.e., excluding own use by power plant) from RE increased by an impressive 382 terawatt-hours (TWh) or 12% in the first six months of this year compared to the same period in 2021. The fact that 2021 is the record year for global electricity generation from RE makes this performance even more remarkable.
Furthermore, it may be noted that in 2022 H1 the growth of RE electricity exceeded that of total electricity generation (+311 TWh). Consequently, electricity generation from fossils & other and nuclear decreased by 48 TWh and 24 TWh, respectively (Chart 1).
Chart 1: World Change in Net Electricity Generation by Technology 2022-2021 H1
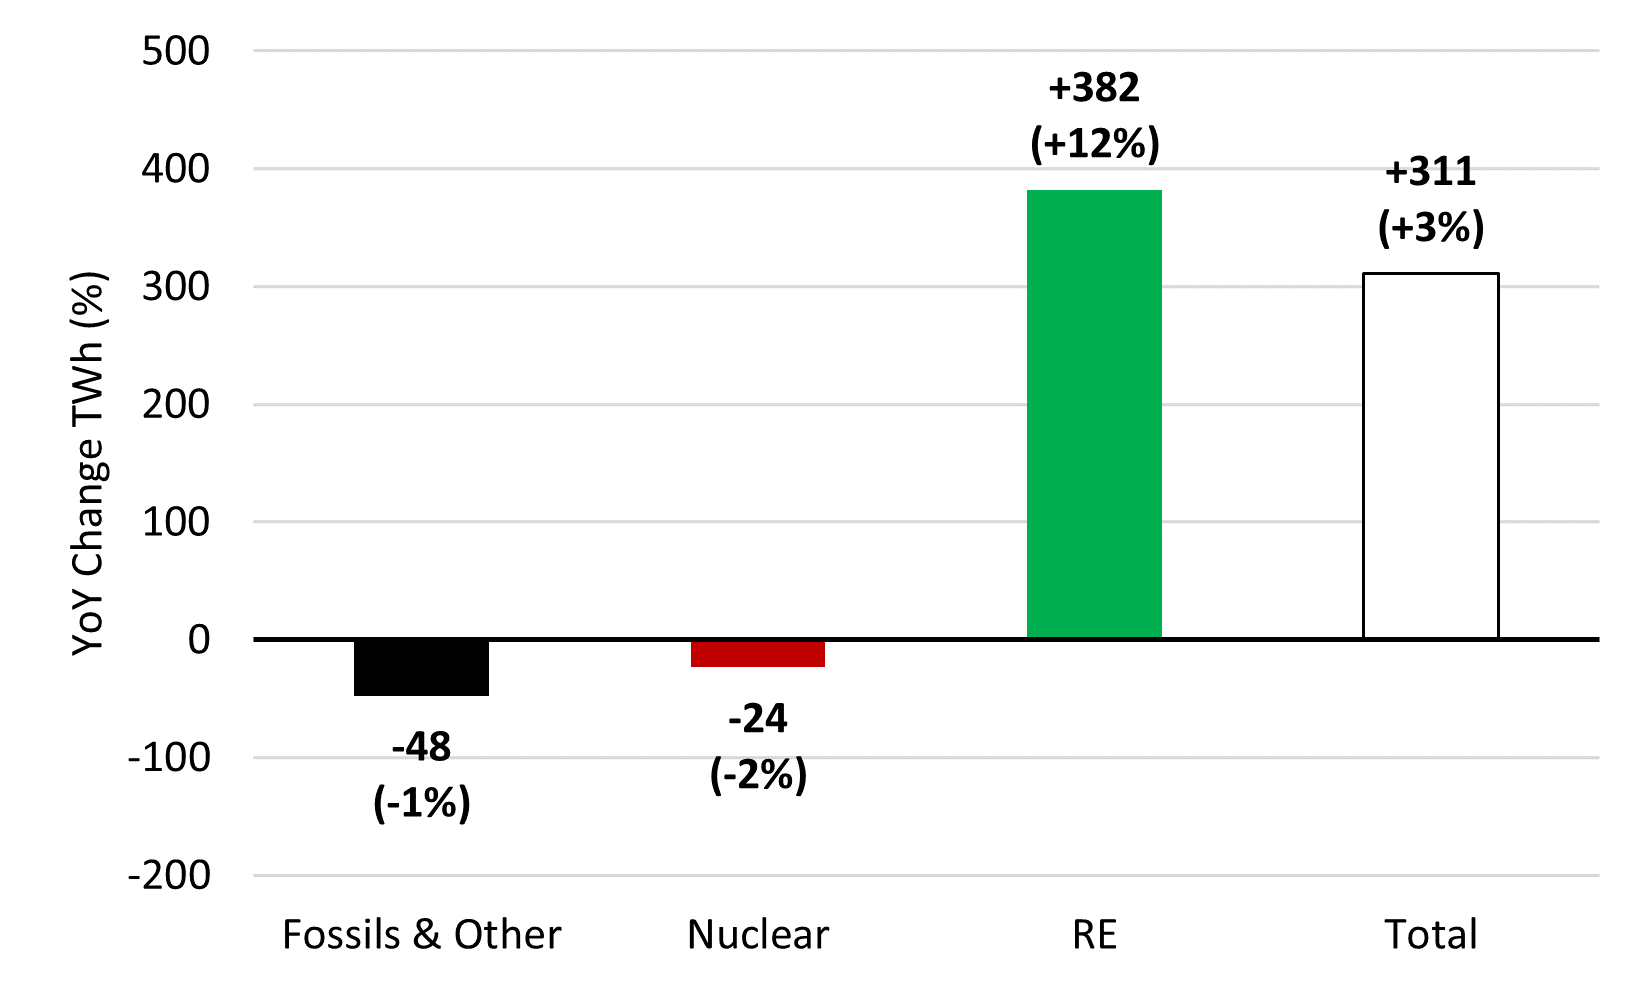
Source: IEA, Monthly Electricity Statistics: Data up to June 2022 (September 2022).
Into more details, among RE, wind, solar, and hydro all increased significantly. And among fossils & other, the main victim of RE was heavily polluting coal (Chart 2).
Chart 2: World Change in Net Electricity Generation Focus “Fossils & Other” and “RE” 2022-2021 H1
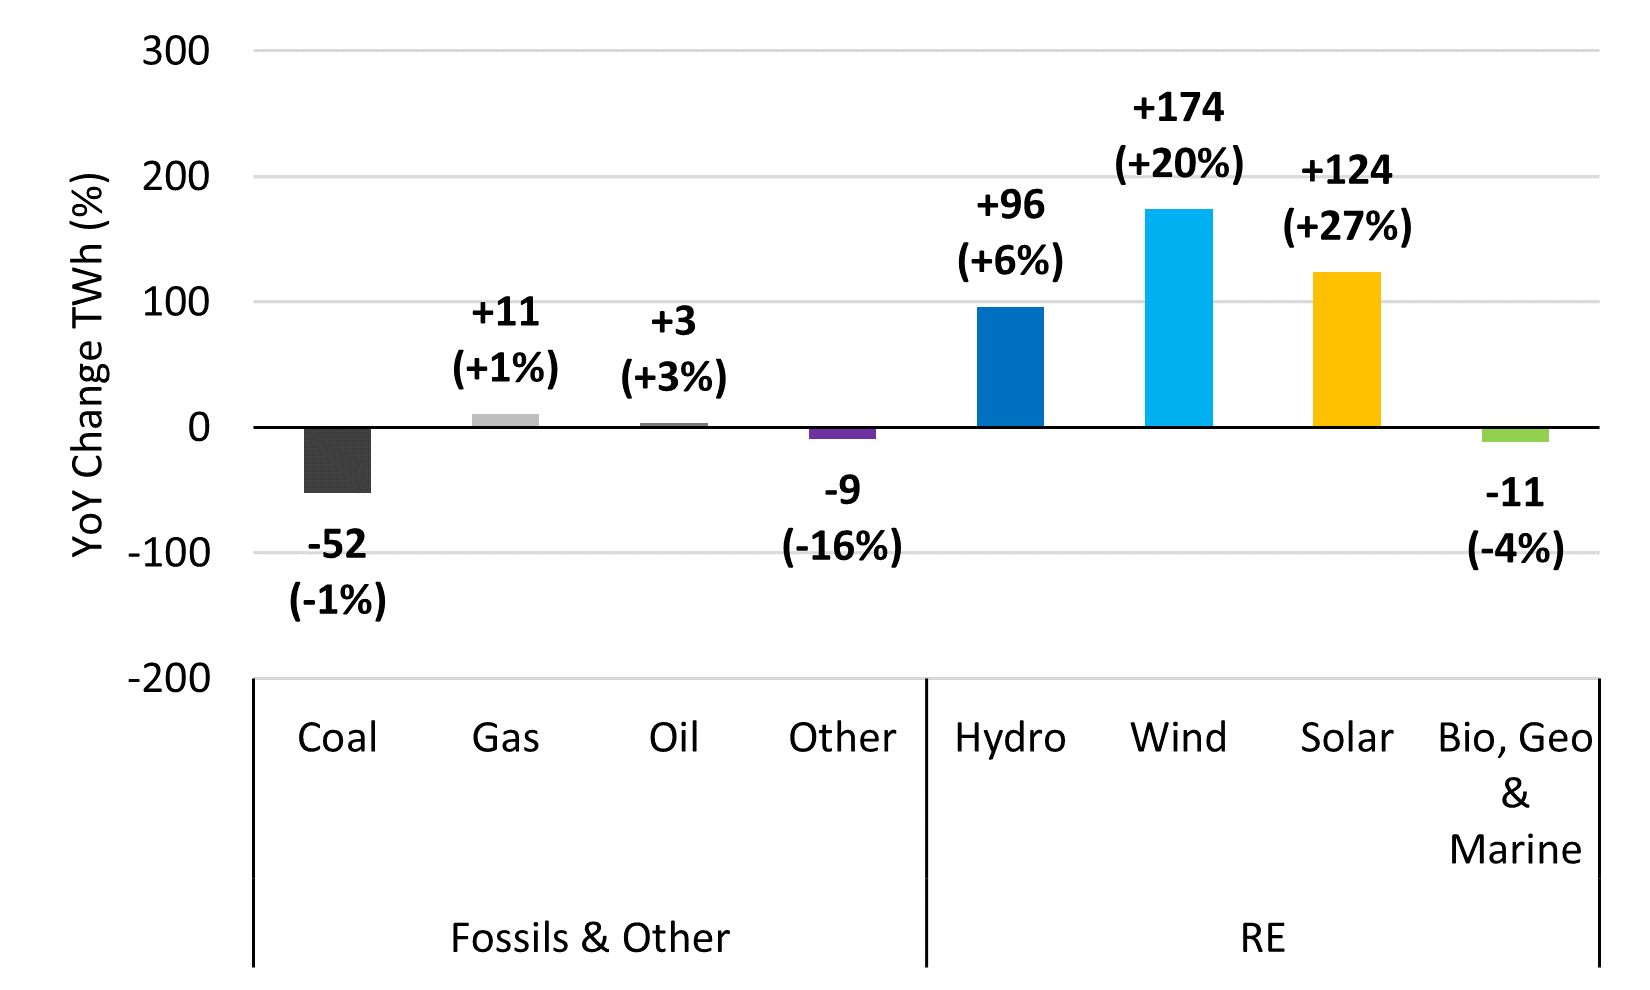
Source: IEA, Monthly Electricity Statistics: Data up to June 2022 (September 2022).
Specifically analyzing the key developments in the world’s main power systems: China, Europe, India, Japan, and the United States is also instructive (Chart 3).
Chart 3: World’s Main Power Systems Change in Net Electricity Generation by Technology 2022-2021 H1
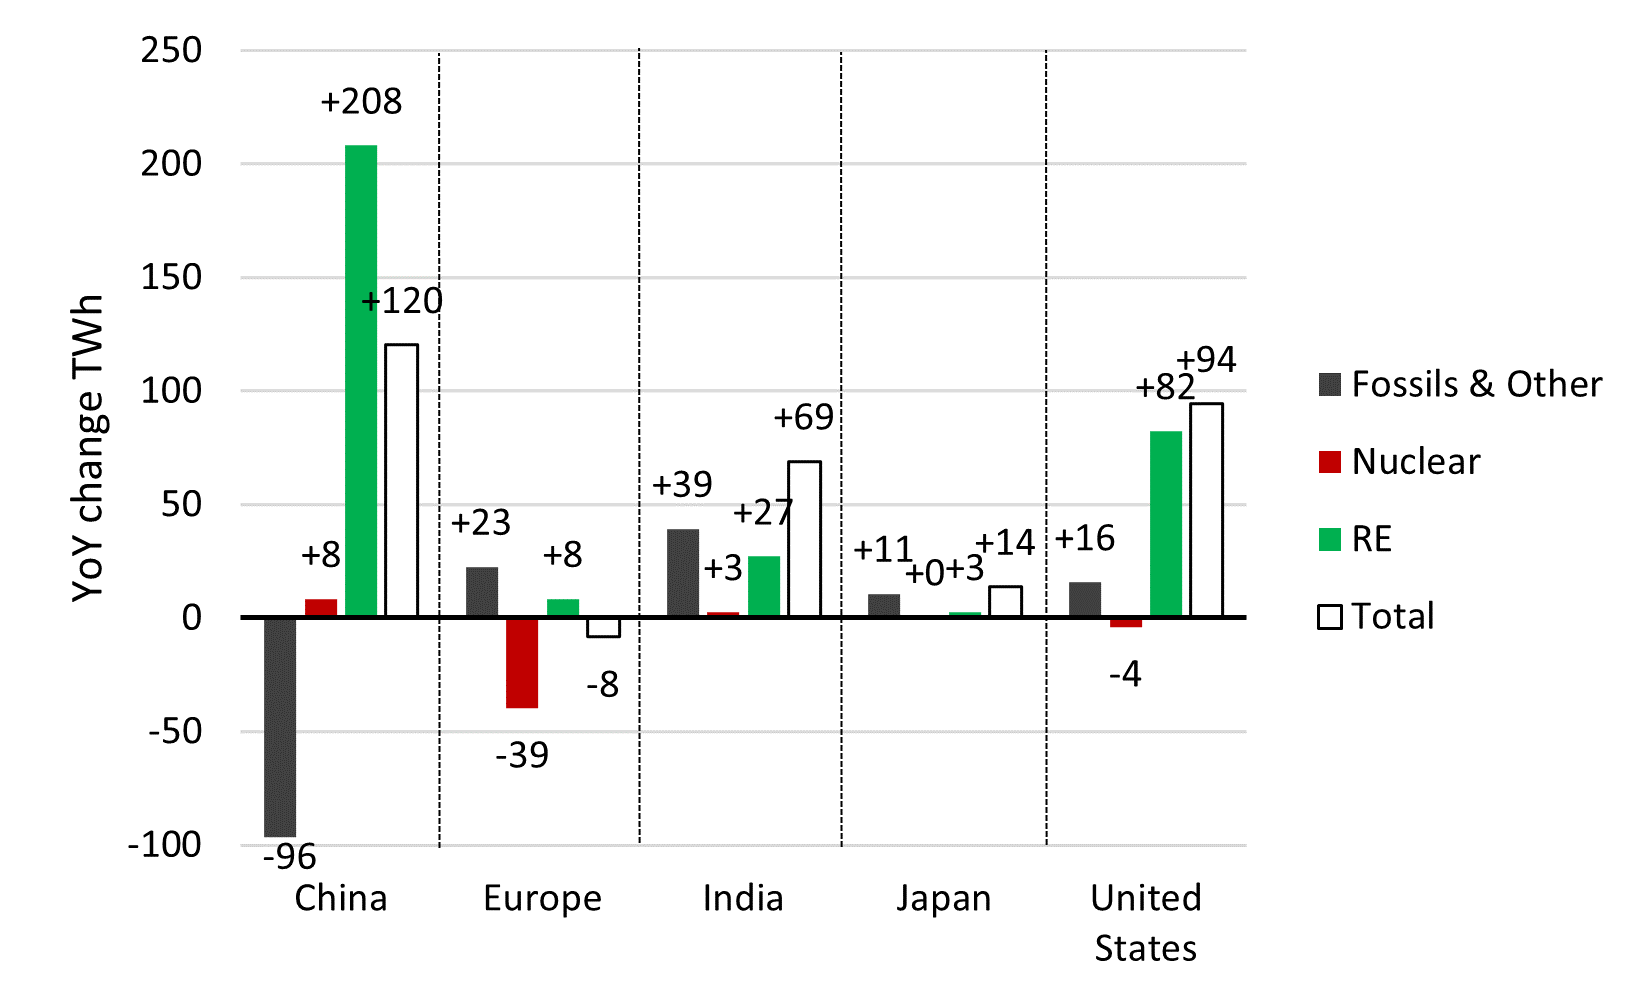
The majority of RE electricity’s global growth came from only one country: China (+208 TWh of RE electricity) – the world’s largest power system, where slightly more than half of RE’s increase came from a combination of wind and solar thanks to new capacity additions, and the rest from hydro thanks to favorable conditions. This increase in RE in China coupled with the negative impacts of repeated COVID-19 related lockdowns on the country’s electricity consumption enabled a significant decrease in electricity generation from fossils & other (-96 TWh, essentially coal). This reduction in electricity generation from fossils & other in China was sufficient to more than counterbalance the increases in electricity generation from fossils & other which took place everywhere else, and especially in India (+39 TWh, essentially coal).
Three other noticeable trends may be highlighted. First, the significant growth of RE in the United States (+82 TWh) mainly owing to wind and solar. The combined growth of wind and solar in the United States was almost 60% of that in China. This is admirable given the United States’ power system is roughly twice smaller than that of China. Second, the significant decrease in electricity generation from nuclear power in Europe (-39 TWh) mostly due to various issues affecting production in France. And third, almost 80% of the increase in total electricity generation in Japan was met by fossils & other (primarily gas) – a setback that should be considered as a warning.
Unabated fossil fuels addiction jeopardizes carbon neutrality
Even if RE electricity growth has been extraordinary in 2022 H1, it did not result in a significant decrease in electricity generation from fossil fuels. This is problematic as the objective of carbon neutrality requires a deep and rapid decarbonization of the power sector.
There is a consensus that the power sector should be the backbone of decarbonization because this is where the substitution of fossil fuels by low carbon RE is the most straightforward from economic and technological perspectives. Yet, after an historical collapse in 2020 (-512 TWh) – a year marked by a record growth in RE electricity and the outbreak of the COVID-19 pandemic, global electricity generation from fossil fuels skyrocketed in 2021 surpassing its previous 2018 peak by a wide margin (including new records for both coal and gas power). This was mainly due to rising electricity consumption on the back of the rebound in economic activity, more extreme weather conditions, and increased electrification (notably that of transport). According to the IEA, for the world to achieve carbon neutrality by mid-century, electricity generation from fossil fuels should be drastically and quickly decreased. For instance, in the rest of the 2020s decade an aggressive reduction of 852 TWh/year should be realized (Chart 4).
Chart 4: World Gross Electricity Generation from Fossil Fuels 1985-2021 and Carbon Neutral Compatible Trajectory by 2050
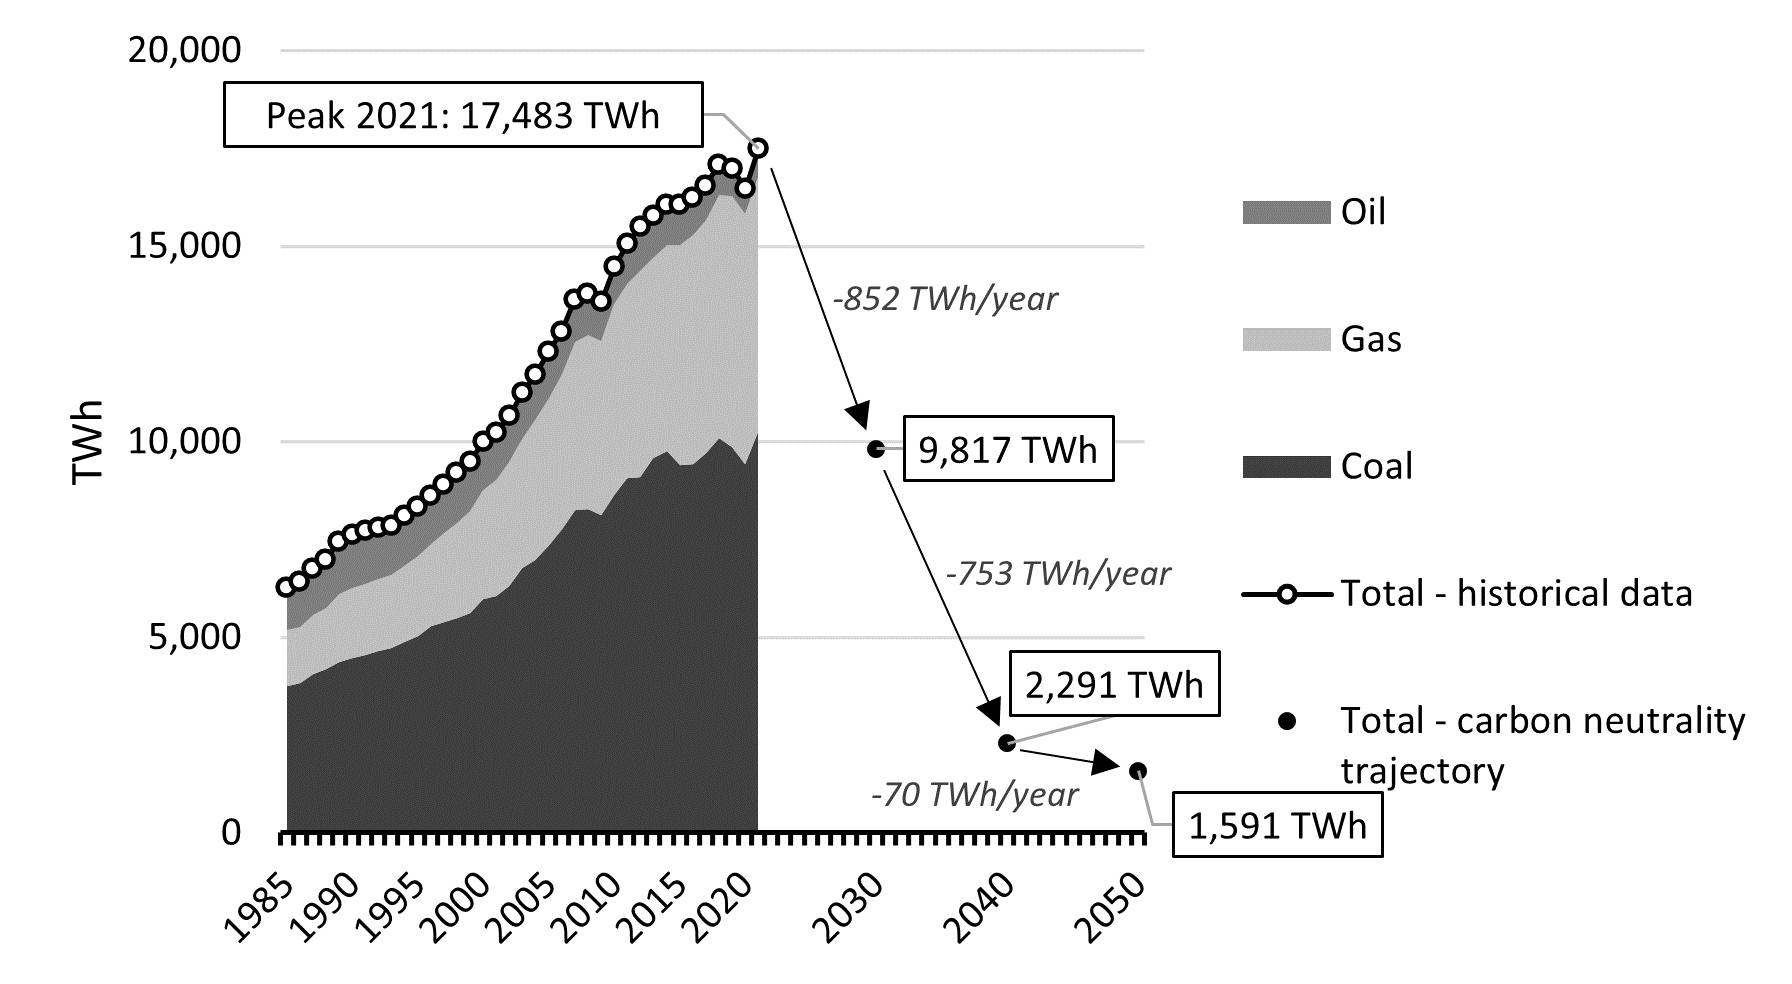
In comparison to this requirement, the mere drop of 48 TWh in electricity generation from fossils & other in 2022 H1 is marginal. Worse, preliminary summer data (July-August) from China even hint to a significant YoY increase in electricity generation from fossil fuels (+100 TWh approximatively), enough to completely erase the small global decarbonization improvement observed in 2022 H1.1 In a worst-case scenario that cannot be ruled out today, a freezing early winter in the northern hemisphere, for example, would definitely spell a new world record for electricity generation from fossil fuels in 2022.
Further accelerating: Taking even more advantage of RE’s strengths and overcoming obstacles
RE electricity is indisputably the cornerstone of energy supply decarbonization. RE electricity’s growth is already spectacular, yet it should be further accelerated.
First, RE outstanding economic competitiveness and strategic value in terms of energy security (i.e., RE resources are essentially domestic) need to be fully recognized by all decision makers around the world and reflected into more ambitious and effective RE policies such as those recently adopted in Europe (“REPowerEU Plan”) and the United States (“Inflation Reduction Act”).2
Regarding RE economics specifically, with the ongoing energy crisis characterized by high fossil fuel prices, the cost competitiveness of RE has never been so evident. Even in Japan, a country where RE has usually been expensive compared to global standards. Indeed, the prices (including construction costs, operation & maintenance costs, and profits for investors) of the cheapest new solar photovoltaic (PV) and offshore wind power plants in Japan recently fell to ¥8.99/kilowatt-hour (kWh) and ¥11.99/kWh, respectively. In comparison, among all the generating costs of existing coal and gas power plants, the only fraction of their fuel costs ballooned to JPY15.71/kWh (steam coal) and JPY19.02/kWh (liquefied natural gas (LNG)) in August 2022 (Chart 5). This is a powerful economic signal that should drive enormous investments in RE.
Chart 5: Japan Most Competitive RE Prices VS. Average Fossil Fuel Costs
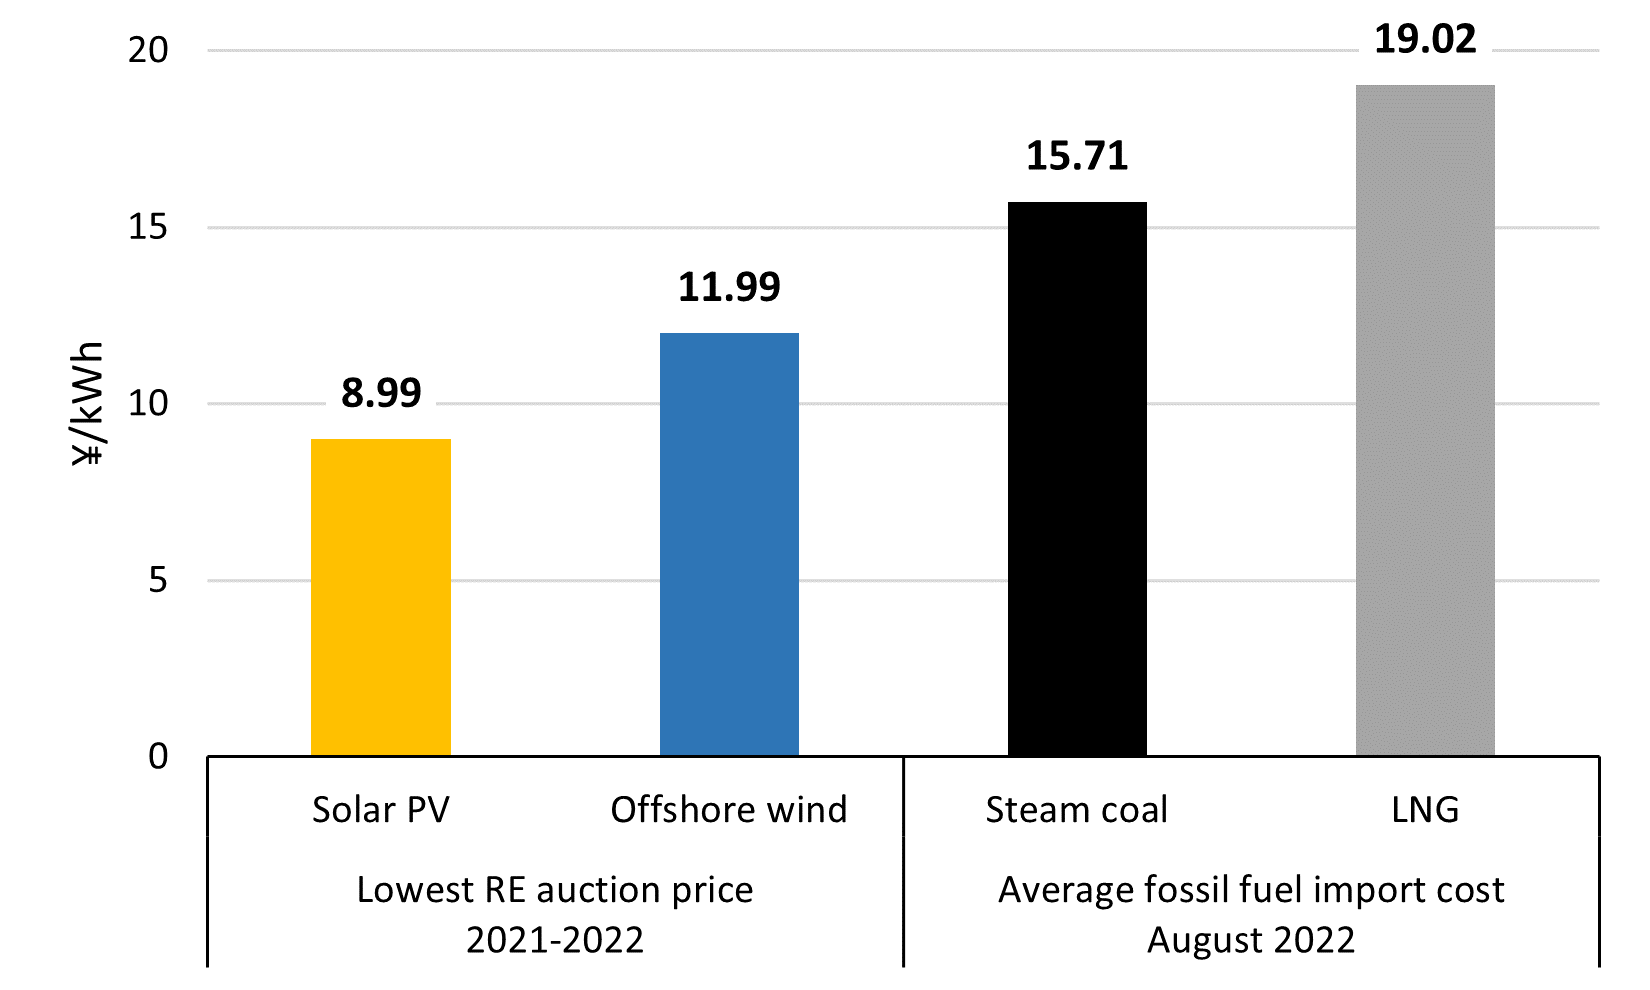
Sources: For solar PV, Green Investment Promotion Organization, Results of the 11th Solar Power Auction – updated March 30, 2022 (in Japanese). For offshore wind, Ministry of Economy, Trade and Industry, Selection of Offshore Wind Farm Operators Off the Coast of Noshiro City, Mitane Town and Oga City, Akita Prefecture, Off the Coast of Yurihonjo City, Akita Prefecture, and Off the Coast of Choshi City, Chiba Prefecture – December 24, 2021 (in Japanese). For steam coal and LNG, Ministry of Finance, Trade Statistics of Japan: Steam coal and LNG. [All URLs accessed October 5, 2022]
Second, it will be important to timely advance solutions for the power system integration of RE and take decisive pedagogical actions to ensure continuous public support for RE.
Implementing a combination of the six following solutions should greatly increase the flexibility of power systems in the coming years and decades making the smooth integration of RE possible: Demand response, grid reinforcement, pumped storage hydro, batteries, decarbonized thermal, and market operations. Among these solutions, it may be noted that in 2021 the deployment of new stationary energy storage capacity greatly accelerated with the addition of a record 10 gigawatts (GW) across the world, raising the global cumulative installed capacity to 27 GW.3
Finally, since RE projects are new infrastructure projects, they have an impact on existing populations and established industries (e.g., agriculture, fishery, tourism…). To prevent oppositions from either slowing down or leading to the cancellation of projects it is necessary to anticipate potential social acceptance issues. Therefore, education and timely consultation of stakeholders as well as transparent information dissemination are fundamental to save precious time the world cannot afford to waste.
- 1China Electricity Council, Monthly Statistics of China Power Sector July (August 2022) & August (September 2022).
- 2European Commission, REPowerEU Plan (May 2022). United States Congress, Inflation Reduction Act of 2022 (August 2022)
- 3BloombergNEF, 1H 2022 Energy Storage Market Outlook (March 2022) – subscription required.