In fiscal year (FY) 2019, from April 2019 to March 2020, electricity generated from fossil fuels (oil, gas and coal) was below its level before the Fukushima nuclear accident. Japan has successfully improved efficiency and deployed solar power, reducing dependence on fossils and nuclear.
Electricity generation from fossil fuels in FY 2019 was 9 terawatt-hours (TWh) below its FY 2010 level, while nuclear has been reduced by more than 220 TWh after the 2011 Fukushima nuclear accident1.
Chart 1: Change in Gross Electricity Generation FY 2019e - FY 2010 in Japan
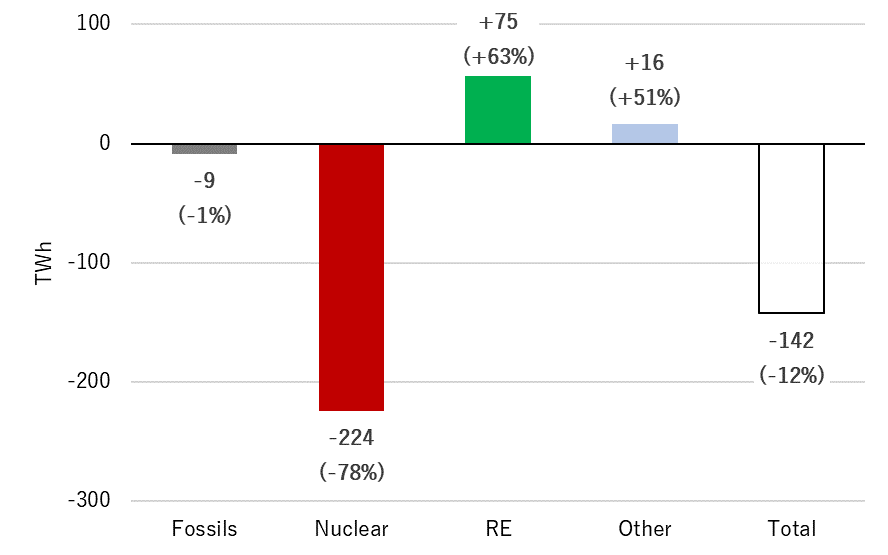
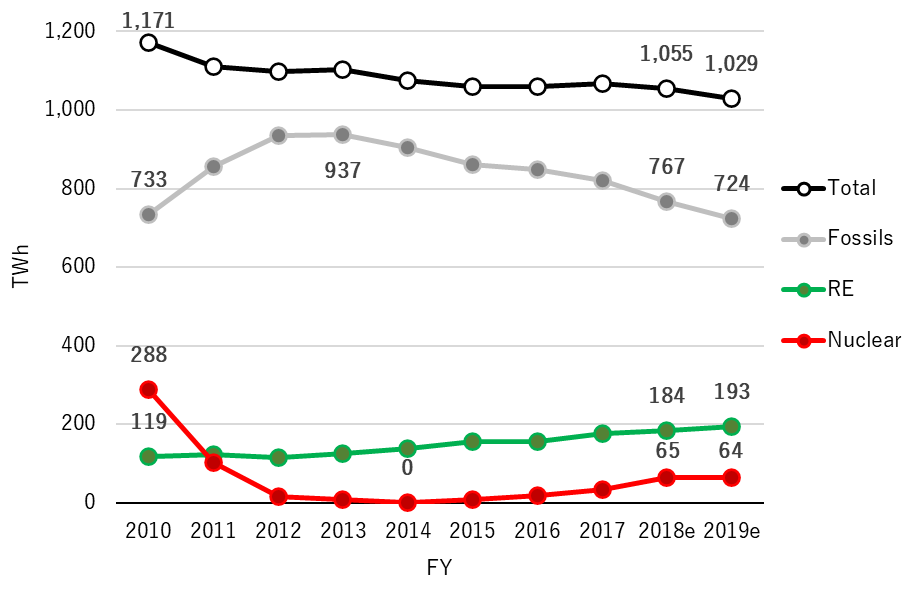
Chart 2: Gross Electricity Generation FY 2010 - FY 2019e in Japan
Key developments deserving particular attention:
- While the economy grew by 8%2 , there has been a decrease in total electricity production from 1,171 TWh in FY 2010 to 1,029 TWh in 2019; -142 TWh, or -12%. This is the result of continuous progress in energy efficiency and energy savings efforts.
- Electricity generation from fossil fuels increased in the aftermath of the Fukushima nuclear accident, peaked at 937 TWh in FY 2013, and is now below its FY 2010 level, or almost one-quarter below its peak level. However, compared to FY 2010, both coal and gas increased; about +20 TWh and +30 TWh, respectively. The decrease in fossil power was thus essentially a decrease in electricity generation from oil; around -60 TWh.
- The small restart of nuclear power has proved slow and expensive due to more stringent safety standards. In FY 2014, there was no electricity generation from nuclear power at all. Between FY 2015 and FY 2019, 9 reactors out of 55 in FY 2010, were in operation3. The share of nuclear power in total electricity generation fell from 25% to 6% over the decade. The FY 2030 target of 20-22% appears unachievable.
- The increasingly cost competitive RE expansion has resulted in an increase of solar photovoltaic (PV) installed capacity from 6 gigawatts (GW) in 2011 to 54 GW as of December 20194 . This increased RE share of electricity from 11 to 19 % of total electricity. Support prices have been reduced to less than one-third; from the first feed-in-tariff of ¥40 per kilowatt-hour to the latest auction price in FY2019 of ¥13/kWh. According to BloombergNEF’s5 the most competitive solar projects, at ¥8/kWh, may outcompete CCGT while avoiding the risks associated to fuel price volatility and greenhouse gas emissions.
Finally, though progress is encouraging, it may be argued that there is still room for improvement:
- Partly replacing oil, by coal – an even more polluting energy source – cannot be satisfying with regard to the ongoing climate crisis, and
- There are quite strong indications that FY 2030 low carbon electricity targets will be exceeded by RE and missed by nuclear. Based on these trajectories more realistic targets should be set in order to achieve the nation’s greenhouse gas reduction goal. This is what should be expected from the next Strategic Energy Plan in FY 2021-FY 2022.
- There are quite strong indications that FY 2030 low carbon electricity targets will be exceeded by RE and missed by nuclear. Based on these trajectories more realistic targets should be set in order to achieve the nation’s greenhouse gas reduction goal. This is what should be expected from the next Strategic Energy Plan in FY 2021-FY 2022.
- 1"Unless otherwise noted all data and illustrations are based on IEA, for FY 2010-FY 2017; Data and Statistics: Electricity – Japan (accessed June 16, 2020), and for FY 2018e and FY 2019e; Monthly OECD Electricity Statistics – Data up to March 2020 (downloaded June 16, 2020). The FY 2018 and FY 2019 estimates are based on net electricity generation applying multiplying factors of: 1.03 to fossil fuels (coal, oil and gas) and other combustibles (bioenergy and waste), 1.09 to nuclear, 1 to RE – except geothermal; 1.11, and 1 to non-specified sources. These factors have been estimated based on the observed ratio gross/net electricity generation for each technology in recent years. The ratio combustible renewables and non-renewables is assumed to be the same in FY 2018 and FY 2019.
- 2Government of Japan, Cabinet Office, Economic and Social Research Institute, National Accounts of Japan - Quarterly Estimates of GDP (accessed June 17, 2020). Constant 2011 Japanese yen (¥).
- 3Japan Atomic Industrial Forum, Current Status of Nuclear Power Plants in Japan - June 4, 2020 (downloaded June 17, 2020).
- 4Agency for Natural Resources and Energy, Feed-in Tariff Portal - Information Disclosure (accessed June 17, 2020) (in Japanese).
- 5BloombergNEF, Levelized Cost of Electricity 1H 2020 (subscription required - accessed May 21, 2020).