

Due to a change in the data format provided by OCCTO as of 12 March 2026, certain actual interconnector power flow data shown in the “Power Supply & Demand Chart,” “Overview Map,” and “Interregional Interconnection Flow Chart” on the Institute's website are displayed as estimated values independently calculated by the Institute.
Please take this into account when using the flow chart data.
Background
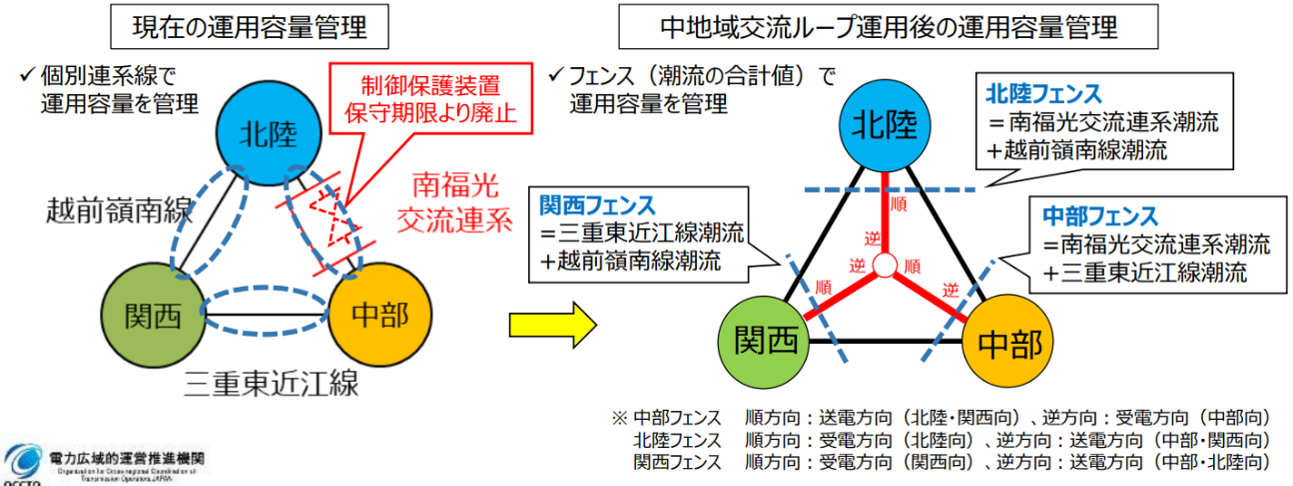
The interregional interconnection lines connecting the Chubu Area, Hokuriku Area, and Kansai Area had previously been operated as follows: the Chubu–Kansai interconnection and the Hokuriku–Kansai interconnection were connected by alternating current, while the Chubu–Hokuriku interconnection was connected by a method in which power was first converted to direct current and then converted back to alternating current, namely BTB: Back To Back.
In OCCTO’s Master Plan, a change to a loop-system configuration, in which all areas would be connected by alternating current, was discussed from the perspectives of improving supply reliability in the event of an N-2 contingency and increasing operational capacity. Accordingly, as shown in Figure 1, the management method was changed from managing operational capacity on each interconnection line to “fence management,” whereby capacity is managed based on inflows and outflows for each area.
In March 2026, the series of construction works was completed. From March 12, OCCTO’s interconnection-line management method was changed, and the data published by OCCTO has also been published as power flows for each fence: the Chubu Fence, Hokuriku Fence, and Kansai Fence.
Figure 1. Changes in transmission-line capacity management accompanying the start of AC loop operation in the Central Region1
Method for Estimating the Power Flow on Each Transmission Line
In the “Electricity Supply-Demand Chart,” “Interconnector Power Flow Map,” and “Interconnector Power Flow Chart” published on the web by the Renewable Energy Institute since 2020, actual power flow data had previously been posted for each of the following interconnection lines: Chubu–Kansai, AC interconnection; Chubu–Hokuriku, DC interconnection; and Hokuriku–Kansai, AC interconnection.
However, because the change to a loop-system configuration associated with the Chubu–Hokuriku AC interconnection occurred in the middle of the fiscal year, and because a certain amount of time is required to modify this website, the Renewable Energy Institute will, for the time being, estimate and publish the power flow values for each transmission line based on the fence power flows.
The estimation method is as follows.
- Kansai Fence: A (Positive in the direction entering Kansai)
- Hokuriku Fence: B (Positive in the direction entering Hokuriku)
- Chubu Fence: C (Positive in the direction leaving Chubu)
- Chubu–Kansai Interconnection Line: x (Positive when the normal power flow direction is from Chubu to Kansai)
- Chubu–Hokuriku Interconnection Line: y (Positive when the normal power flow direction is from Chubu to Hokuriku)
- Hokuriku–Kansai Interconnection Line: z (Positive when the normal power flow direction is from Hokuriku to Kansai)
The relational equations are:
A=x+z
B=y-z
Assuming that transmission losses and other factors along the way can be ignored, and that C=A+Bholds, meaning that the sum of the fence power flows is zero, the minimum-norm solution1 for x, y, and zcan be derived as follows:
y=(A+2B)/3
z=(A-B)/3
In the Renewable Energy Institute’s “Electricity Supply-Demand Chart,” “Interconnector Power Flow Map,” and “Interconnector Power Flow Chart,” this minimum-norm solution will be published as the estimated value of the interconnector power flow.
However, in actual transmission-line operation, due to factors such as the impedance characteristics of each interconnection line, it is entirely possible that the minimum-norm solution obtained by the above calculation method will differ from the true interconnector power flow values. When conducting data analysis or similar work, please download and use the primary data from OCCTO.
“Power Supply & Demand Chart,” “Overview Map,” and “Interregional Interconnection Flow Chart”