The site is created with data published by TSOs and OCCTO since April 2016 and allows you to visualize and analyze the collected data in the form of charts and map of Japan. The spot prices of the JEPX day-ahead market is also available.
The power status of nine areas in Japan can be viewed, and enables you to interactively customize the graphs to your own needs. We hope this will be an effective tool for those seeking information and support various studies, foster and facilitate policy decisions on Japan's energy transition.
Overview
URL:https://www.renewable-ei.org/en/statistics/electricity/
(TOP > Statistics > Charts & Map)
1. The Chart of Power Supply & Demand in Japan
Using power supply and demand record data in nine TSOs’ areas.
The main features are as follows:
(1) You can view the time period by selecting dates and even choose the period by sliding the bar at the bottom of the chart.
(2) You can display the total of selected multiple areas.
(3) You can also choose to view the spot prices of the JEPX day-ahead market.
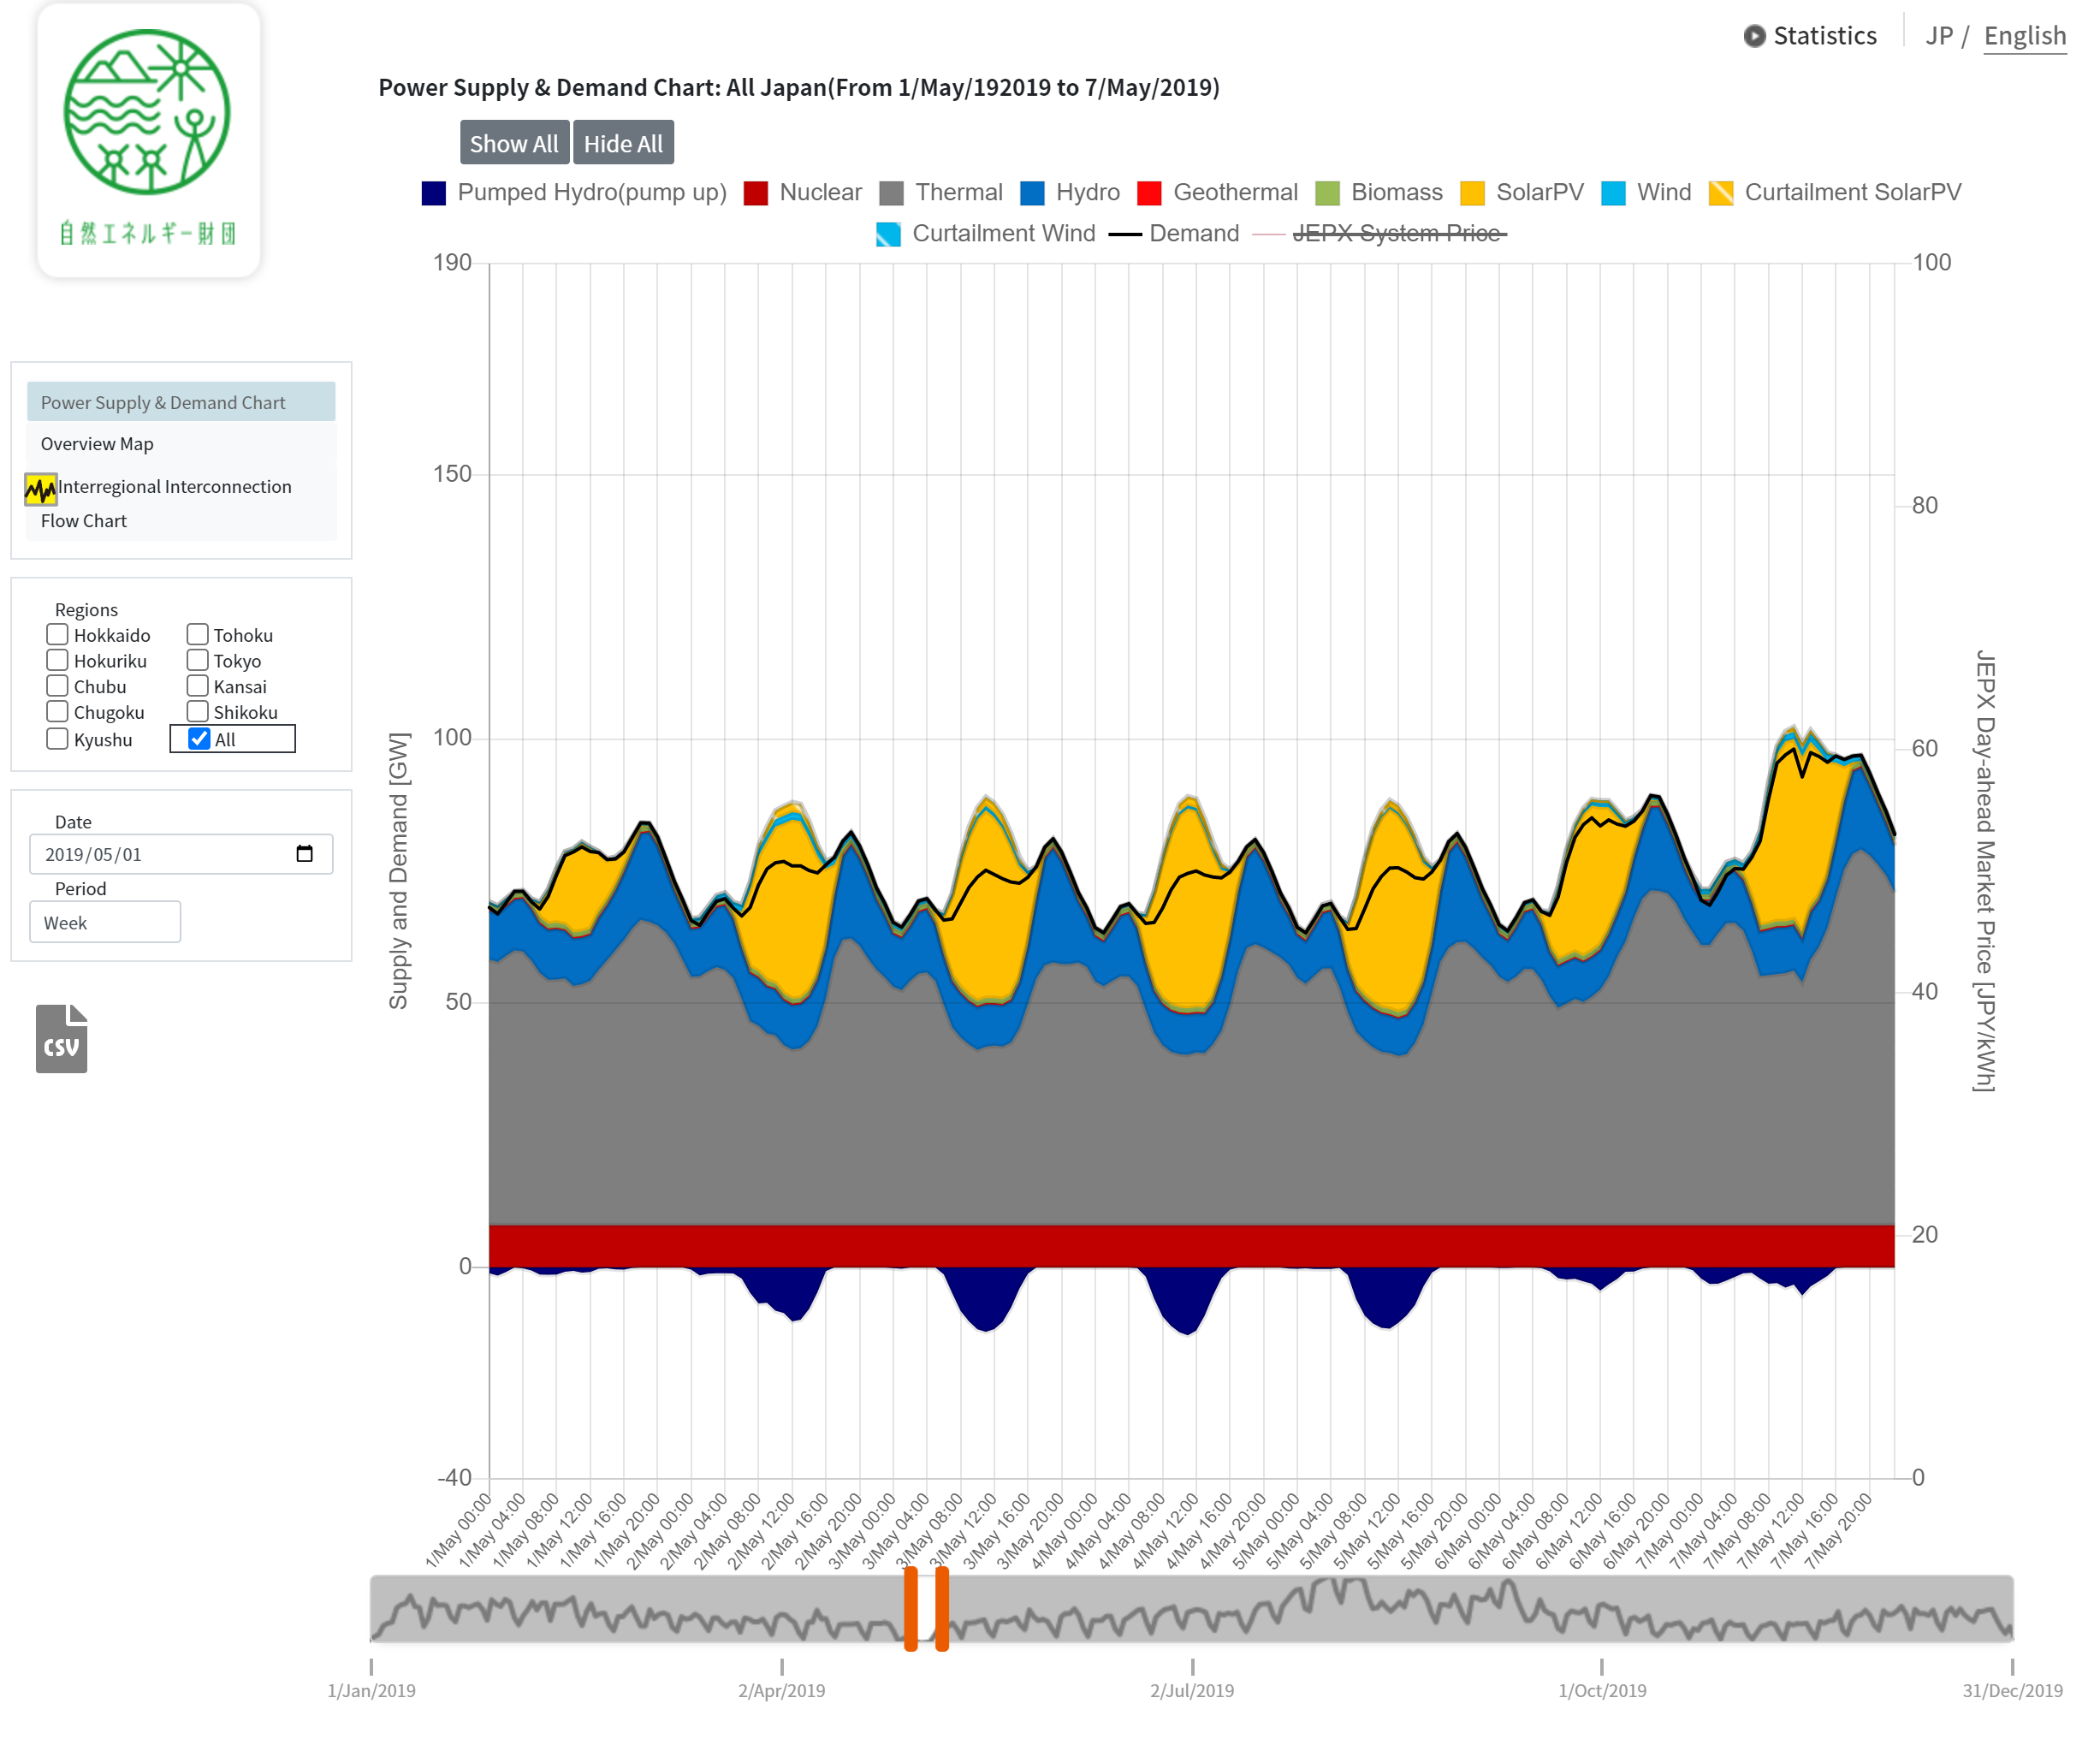
Note: The JEPX day-ahead market is traded in units of 30 minutes, but the chart shows the hourly average prices in accordance with the power supply and demand format provided by TSOs. For the power generation (output) by pumped storage is displayed within the output by hydro power generation.
2. The Map of Power Supply & Demand and the Power Flow of Interregional Interconnections
Every hour information of each nine TSOs area is laid out and visualized with a map of Japan. The power supply and demand in each area is displayed in a bar graph, and the renewables power output rate vs. demand is displayed in a pie chart. The map can also provide you the JEPX day-ahead market prices and the actual power flow of the interregional interconnections.
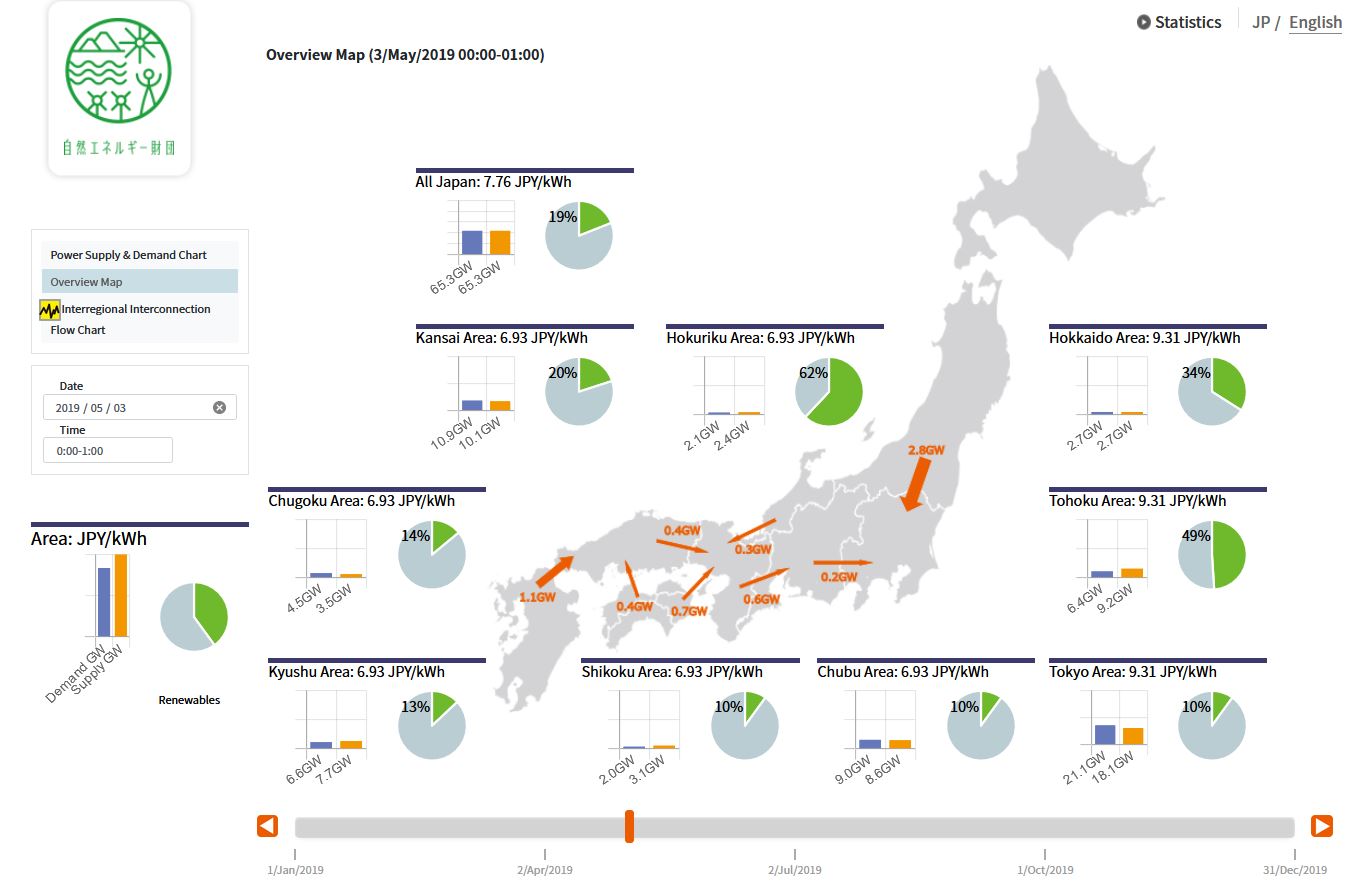
Note: The JEPX day-ahead market is traded in units of 30 minutes, but the chart shows the hourly average prices in accordance with the power supply and demand data provided by TSOs. For the power generation (output) by pumped storage is displayed within the output by hydro power generation.
The actual power flow of interregional interconnections data by OCCTO is provided as every 5 minutes on its site, but here it is processed and displayed as an average value for 60 minutes in accordance with the power supply and demand data format provided by TSOs.
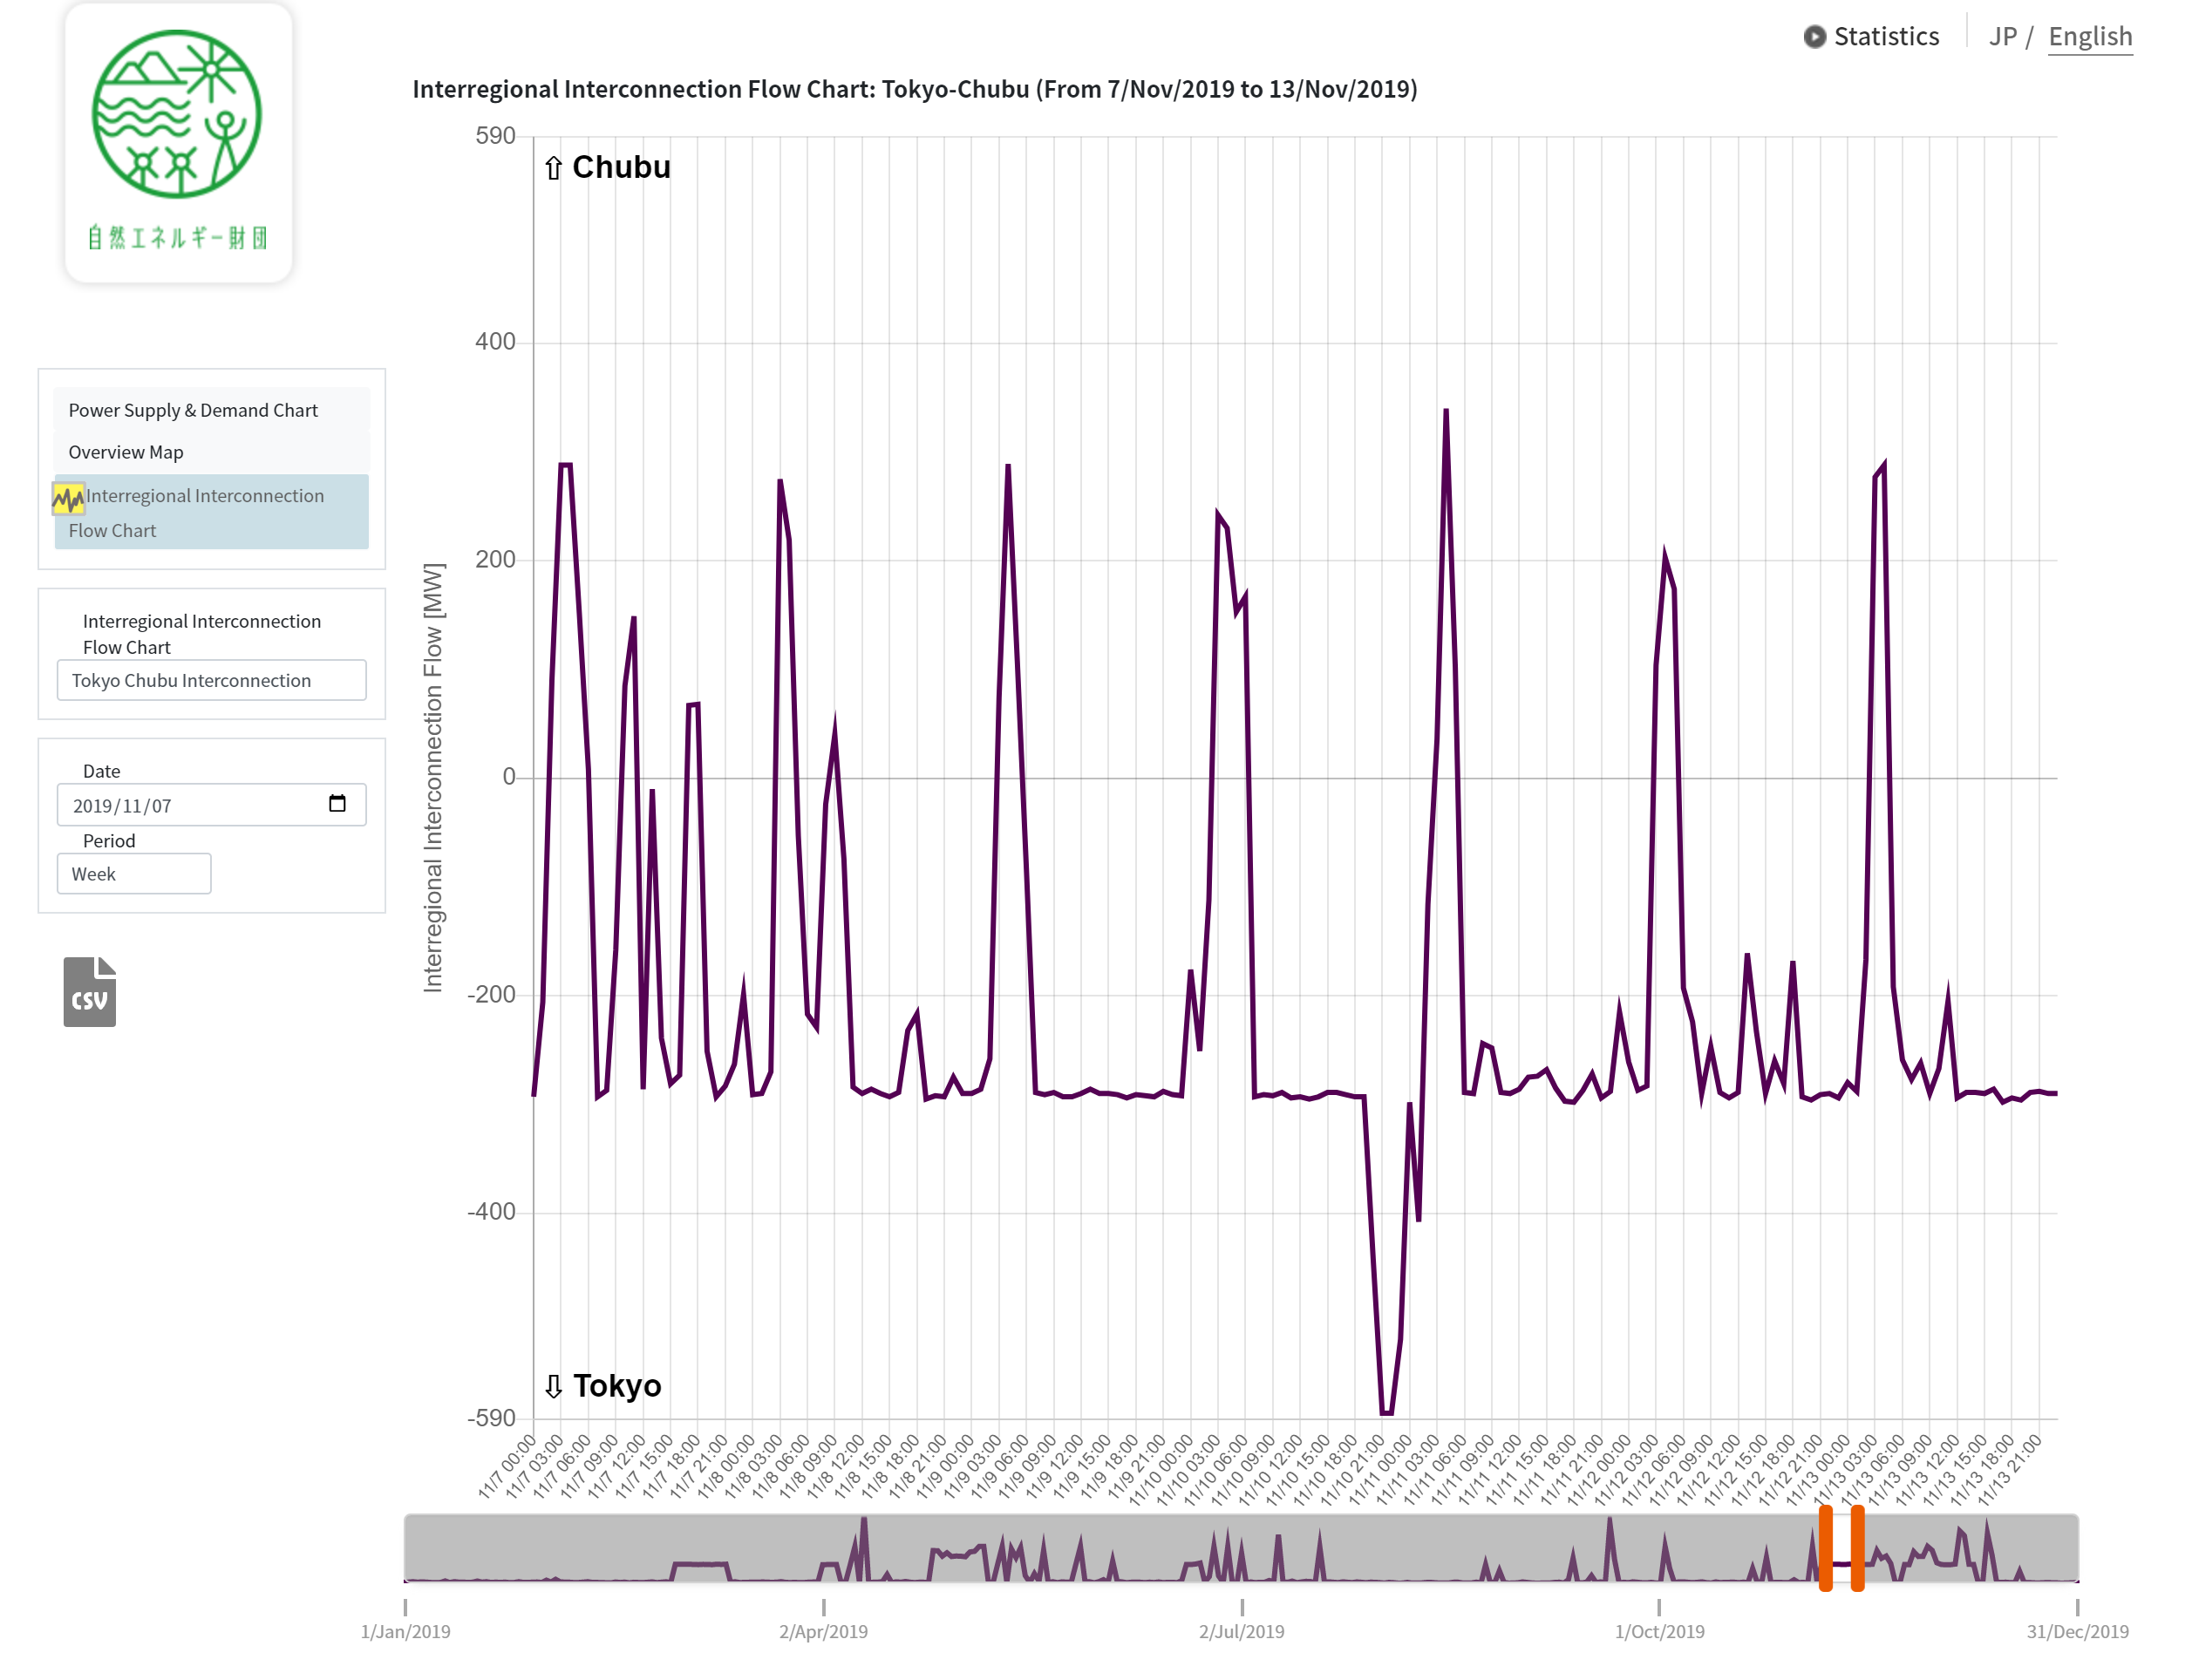
3. The Power Flow Chart of the Interregional Interconnections
The chart displays actual hourly power flow data of ten interregional interconnections in nine areas in Japan.
Data period and update frequency
The data on power supply and demand are from 1st April 2016, and the data on power flow of interregional interconnections are from 1st June 2016. Frequency of updating data is planned for once a month, the latest data is the actual data of two months before.
(Example) Data for May 2020 will be updated in the middle of July 2020.
Data disclaimer
While we have used our reasonable efforts to ensure the latest accurate information available on the site, however, Renewable Energy Institute is not responsible for its accuracy. The data released by TSOs and OCCTO may be revised retroactively, and the data on the site may be revised accordingly.
Citation
You can use the downloaded figures and data freely. However, when citing, please use the credit notation in the following form:
[Examples]
Source: Renewable Energy Institute, "Power Supply & Demand and Interregional Interconnection Power Flow Map at DDMMYYYY".
Source: Renewable Energy Institute, "Power Demand & Supply Chart in Tokyo Area from DDMMYYYY to DDMMYYYY".
Source: Renewable Energy Institute, "Interregional Interconnection Power Flow Chart at Tokyo-Chubu interconnection link from DDMMYYYY to DDMMYYYY".